The problem
Skaneateles Lake is the primary water supply for the City of Syracuse, and harmful algae blooms have been appearing in it.
Blooms are rapid growth of cyanobacteria. They deplete oxygen in the water, release toxins, and for a city drawing its drinking water from the lake they require intensive monitoring and treatment. Early detection reduces that cost, and early detection requires frequent coverage of the whole lake rather than spot sampling from a boat.
The city issued a request for proposal for an unmanned aircraft system that could detect and map blooms in near real time and direct a sampling boat to them. This project is the response: select the platform, design the operation around it, and produce the safety case and airspace authorisation needed to fly it.
Group project with a team of four at Carleton University.
Platform selection
Aircraft selection used a three-stage scoring method. The stages were kept separate so that a capable but non-compliant aircraft could not score well on performance and remain in contention.
Stage one scores each candidate 1 or 0 against the regulatory requirements the operation is bound by, with a written reason recorded against every score so the decision stays traceable. The requirements were parachute equipped, maximum mass at or below 25 kg, and no laceration risk. Failing any single requirement eliminated the aircraft.
Stage two scores the mission and design requirements from 3 to 1, where 3 exceeds the requirement and 1 fails to meet it. The criteria were flight range against a 100 km target, launch and recovery compatibility, ease of transport and setup, availability of the energy source, autonomous waypoint following, and whether the hyperspectral imager was integrated.
| Mission requirement | Design requirement |
|---|---|
| Range | At least 100 km |
| Max altitude | At least 760 m (2,500 ft) |
| Launch method | Hand launched or VTOL |
| Recovery method | Parachute or VTOL |
| Autonomy | Waypoint following |
| Energy source | High availability |
| Payload | Hyperspectral imager and optical camera |
Range and altitude are both derived from the survey track required to cover the lake. No location around the lake has room for a conventional runway, which drives the requirement for VTOL or hand launch with parachute recovery. Waypoint following is required because the survey is a long repetitive track, and autonomous execution removes pilot error caused by a low-workload mission.
More than one aircraft cleared the first two stages. The final stage compares the remaining candidates directly and selects the one closest to the requirements rather than furthest above them, so the operation is not paying for capability it does not use.
Aircraft and payload
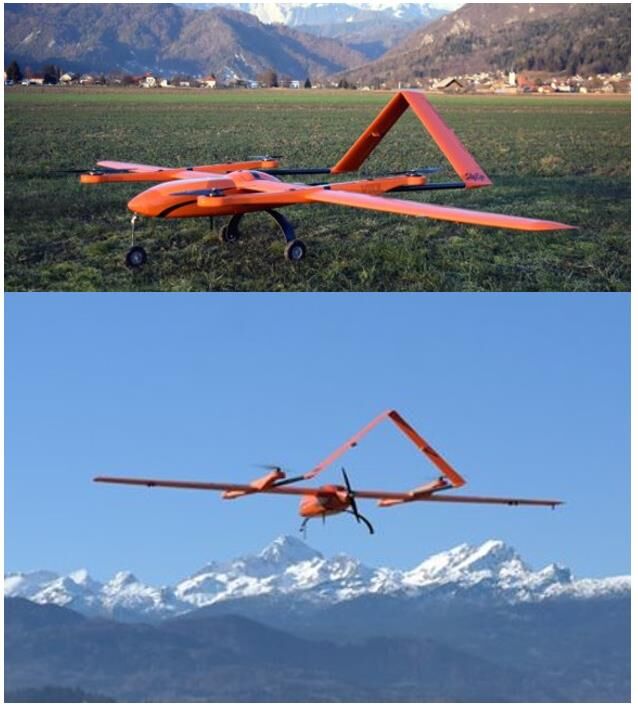
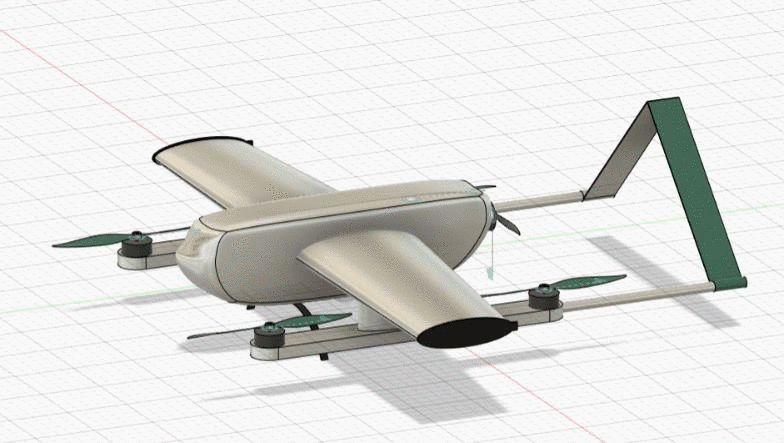
The selected aircraft is the ElevonX Skyeye Sierra VTOL, a hybrid multirotor and fixed-wing design. It uses five electric motors: four lift rotors for vertical takeoff and landing, and one pusher motor for forward flight.
| Parameter | Value |
|---|---|
| Aircraft weight | 12.5 kg |
| Payload weight | 0.46 kg |
| Dimensions | 310 × 152 cm |
| Operational range | 320 km |
| Endurance | 3 hours |
| Operational footprint | 10 × 10 m |
| Link | 868 or 900 MHz, 57 kbps |
| Recovery | Parachute equipped |
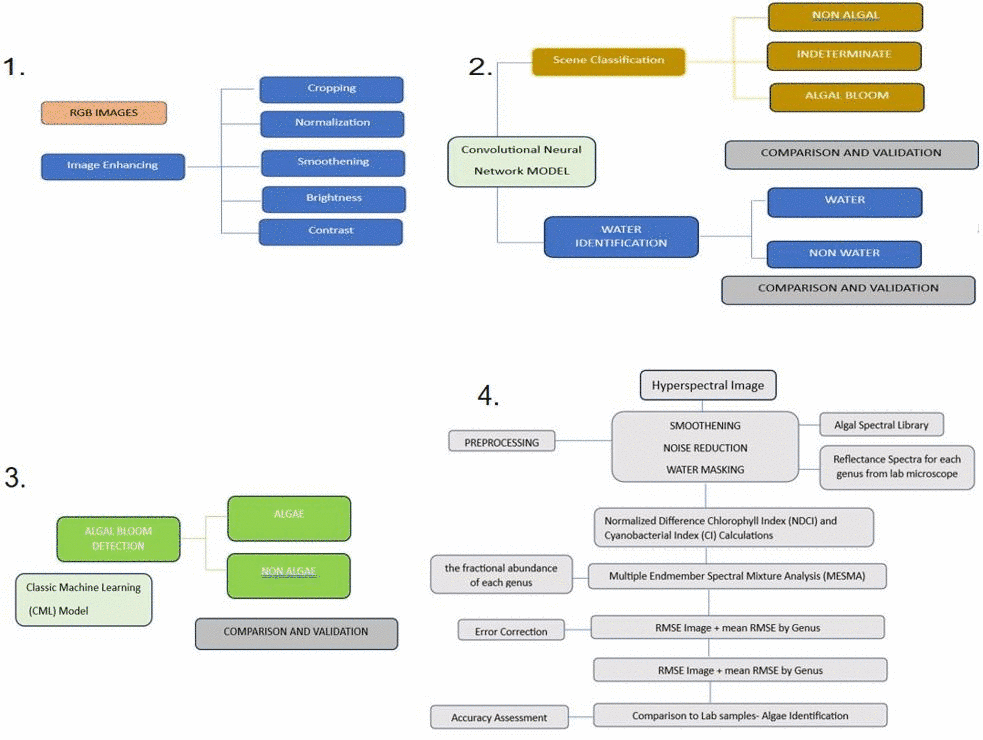
The payload is a MicaSense Altum-PT, integrated by the manufacturer. Bloom detection runs in four steps. RGB imagery is first enhanced and normalised, then classified into non-algal, indeterminate and definite bloom. Water areas are extracted and masked so that shoreline and vegetation do not interfere. A classic machine learning model then detects blooms in the remaining imagery, and a spectral band approach separates algae genera against a lab-derived spectral library.
Communications
Two data links are required. The optical image downlink is mission critical, because the boat crew uses the imagery to navigate to sampling points. The control uplink is safety critical, because it is required to move the aircraft if another aircraft enters the operating airspace.
Skaneateles Lake is close to a number of cell towers, which are a potential interference source. Interference was estimated by taking the nearest tower to the flight path, in Syracuse at approximately 1,500 m, and treating its signal strength as noise at the aircraft.
| Metric | Value |
|---|---|
| Power output | 3 kW |
| Antenna gain | 18 |
| Total loss | 1 (worst case) |
| Frequency | 900 MHz |
| Minimum range | 1,500 m |
| Noise at aircraft | 16.9 µW, −17.72 dBm |
This figure does not close the analysis on its own. Determining whether the links hold requires the transmitter power and the required signal-to-noise ratio for the radio, neither of which the manufacturer publishes. Both are outstanding questions for the OEM.
Concept of operations
The operation runs in nine phases, with the flight crew relocating to a boat partway through.
The phases are boat launch, aircraft takeoff, ascent, loiter, cruise and survey, loiter, descent, landing, and boat recovery. The aircraft takes off vertically from the marina while the pilot remains on land maintaining visual contact, climbs to survey altitude on pre-loaded waypoints, and holds at a position offshore designated the home waypoint while the pilot boards the boat.
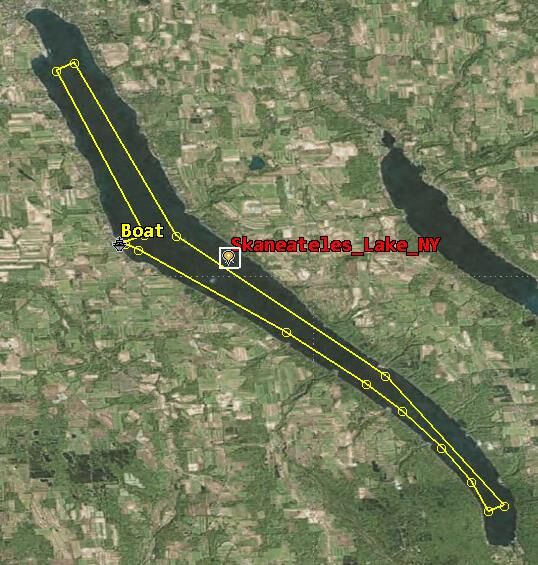
The home waypoint is positioned offshore so the aircraft does not loiter above anyone not involved in the mission, and it is the designated recovery position that every contingency response in section 05 refers back to.
During the survey the aircraft follows its waypoints without manual input. The pilot monitors telemetry and a dedicated visual observer scans the airspace for traffic. When a frame is flagged as a bloom, the aircraft transmits the GPS coordinate and a marked RGB image to the boat, and the technician adjusts the boat route to intercept the position and take a water sample.
Contingency procedures
Each failure mode is mapped to a defined response, and the responses escalate in a fixed order.
| Event | Response |
|---|---|
| Collision hazard | Adjust flight path clear of the intruder, descend to the Part 107 400 ft ceiling |
| Leaves flight geography | Commanded or manually flown back inside |
| Leaves contingency volume | Flown back; parachute deployed to end the mission if unresponsive |
| Partial control surface failure | Return to home point and begin emergency landing; parachute if navigation is not possible |
| Total control surface failure | Parachute deployed to end the mission |
| Loss of communication link | Crew maintains visual and monitors airspace; failsafe triggers if the aircraft exits the contingency volume |
Parachute deployment sits at the end of the escalation rather than being the first response, and requires the aircraft to have failed to respond to a command. A programmed failsafe covers the case of multiple simultaneous mission-critical events, so an aircraft that has lost its link and then exits the contingency volume deploys without waiting for a command it cannot receive.
Safety case
The safety assessment determines whether the operation is permitted at all, and sets the assurance level everything else is held to.
The method is the Specific Operations Risk Assessment developed by JARUS. It establishes the harm the operation could cause on the ground and in the air, applies mitigations to reduce both, and produces a Safety Assurance Integrity Level that determines how rigorously the rest of the operation must be demonstrated. This operation was assessed at SAIL II.
Operational volume
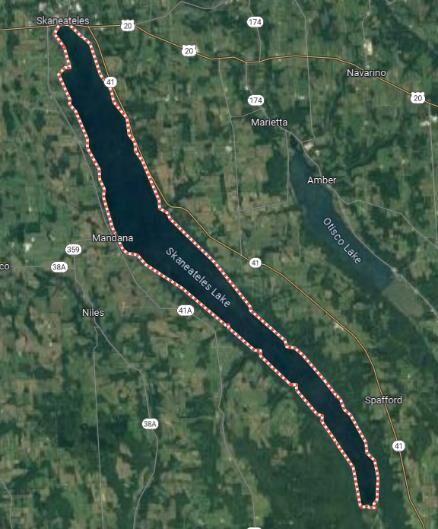
The flight geography is the volume the aircraft is intended to remain within. The contingency volume surrounds it and is the buffer the aircraft may enter before the emergency procedures escalate. Here the waypoints are planned so that they never come within 500 ft of the shoreline, and that 500 ft line defines the start of the contingency volume.
Ground risk
Intrinsic ground risk is set by the energy the aircraft carries into an impact. Worst-case kinetic energy was computed for both flight regimes, since cruise and rotor-borne speeds differ by approximately a factor of three:
| Regime | Mass | Speed | Kinetic energy |
|---|---|---|---|
| Fixed wing | 12.96 kg | 18 m/s | 2,100 J |
| Rotorcraft | 12.96 kg | 52.75 m/s | 18,031 J |
Both values fall below the 34 kJ band. Combined with beyond visual line of sight operation outside a population centre, this gives an intrinsic ground risk class of 3, which is not acceptable without mitigation.
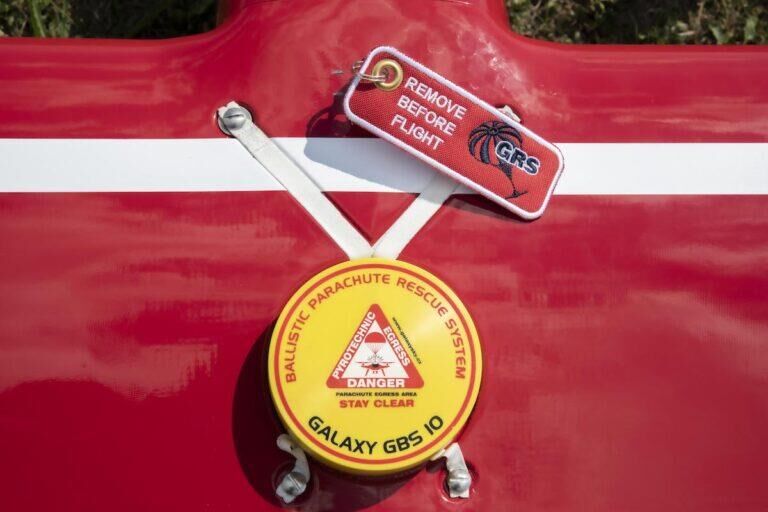
Two mitigations were applied. M1 reduces the number of people at risk: the survey is flown over the middle of the lake, only takeoff and landing occur over land, and the aircraft loiters over water between them. This is assessed at low robustness and contributes −1. M2 reduces the energy at ground impact and is the parachute system. Because the Galaxy GBS 10 has a laboratory test report and has been accredited by a competent third-party military institution, it is assessed at high robustness and contributes −2. The final ground risk class is 1.
Air risk
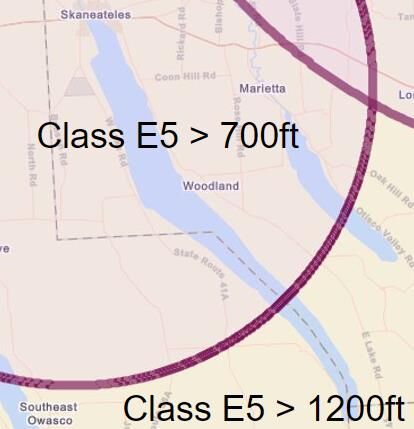
The survey operates at 2,500 ft inside Class E5 controlled airspace, which gives an initial air risk class of ARC-d and an initial generalised density rating of 4.
JARUS Annex C permits an operator to demonstrate that the generalised density rating is incorrect for a specific operation. Rather than accepting the default, two days of flight radar data were collected over the operational volume.
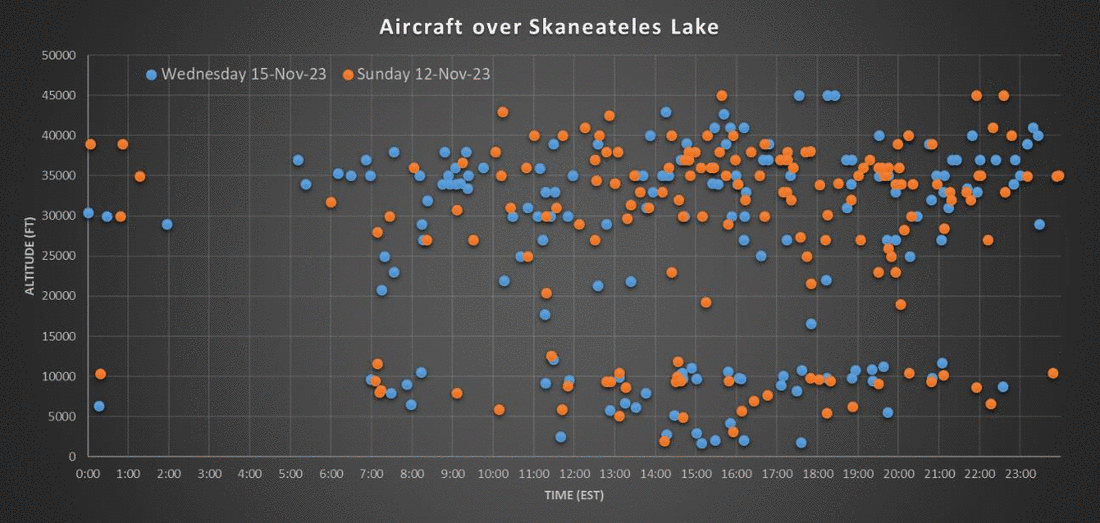
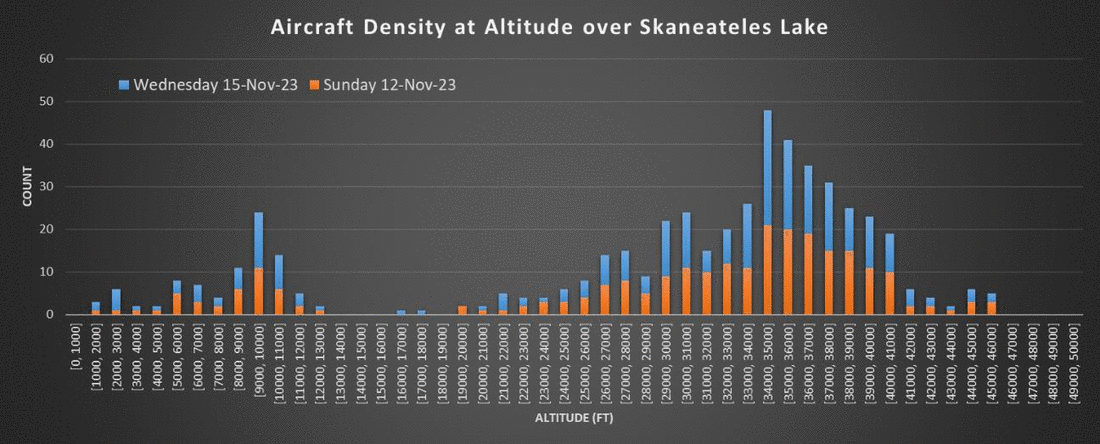
Across both days, seven aircraft came within 500 ft of the mission altitude, and all seven were recorded in the afternoon. Restricting the operation to morning hours reduces the density rating to 1 and the air risk to ARC-b. Tactical mitigations remain in place regardless: the pilot maintains communication with local air traffic control, NOTAMs are published, and a dedicated visual observer monitors for non-cooperative traffic.
The generalised density rating supplied by the method is conservative because it has to cover a wide range of operations. Two days of publicly available tracking data replaced that assumption with a measurement and moved the operation two air risk classes, at no cost beyond the collection time.
Operational safety objectives
SAIL II carries 24 Operational Safety Objectives, covering crew training and procedures, aircraft design, and how the operation handles deteriorating weather. All 24 were evaluated against the operation as described and each was met or exceeded at the level SAIL II requires. Adjacent airspace containment is satisfied by the escalation procedures in section 05.
Survey altitude
Raising the survey altitude produced the largest efficiency gain in the mission, at the cost of additional airspace authorisation.
The mission was initially planned at 400 ft, since remaining below that ceiling avoids most waivers and authorisations. Simulating it in STK showed this was impractical. The lake is long, the imaging swath from 400 ft is narrow, and covering the full surface requires a track of approximately 250 km flown as a dense back-and-forth pattern, which exceeds a single sortie and loads the aircraft with turns.
Climbing to 2,500 ft widens the swath sufficiently that the lake is covered by traversing it once and returning, reducing the track to approximately 50 km. This gives the same coverage at a fifth of the distance, with substantially fewer manoeuvres, and fits inside the aircraft endurance.
| Survey altitude | Track length | Consequence |
|---|---|---|
| 400 ft | ~250 km | Minimal authorisation, impractical flight time |
| 2,500 ft | ~50 km | Single traverse, Class E5 airspace authorisation required |
The cost of this decision is the air risk problem in section 06. Operating at 2,500 ft places the aircraft in controlled airspace and sets the initial air risk at ARC-d, which the flight radar analysis was required to reduce.
Lifecycle cost
The mission runs for 106 days, from 1 May to 30 September, flying approximately three hours per day through bloom season. Costs were separated into initial acquisition and ongoing operation.
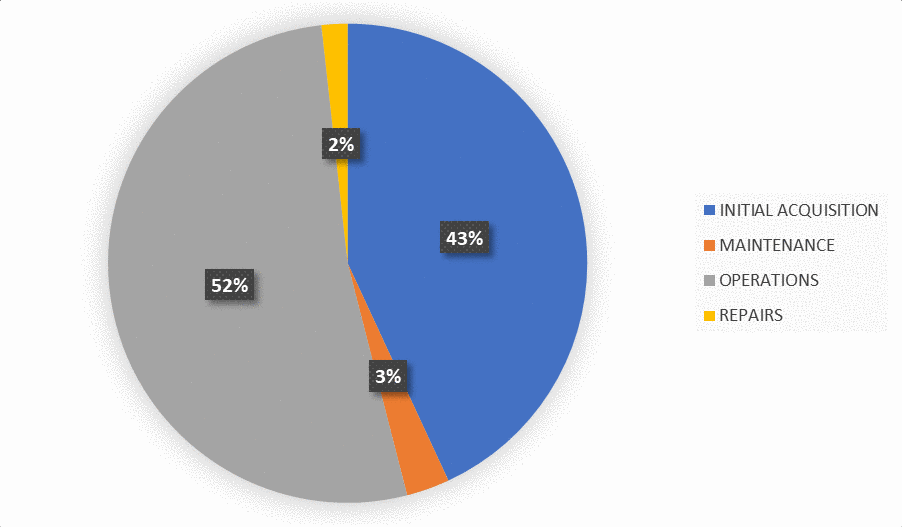
Acquisition covers the aircraft, camera, water sampling kit, crew training, and the registration and knowledge test fees. Running costs are dominated by salaries, followed by vehicle rental, fuel for the boat and truck, insurance, marina mooring and battery replacement. Repair costs are estimated low on the assumption that a reliable platform selected through section 02 and a maintenance plan keep them there, which is an assumption rather than a measured figure.
At end of life the aircraft and support equipment are transferred to the city rather than written off, since continuous maintenance through the season leaves the system serviceable.
Limitations
This is a feasibility study and a paper safety case. No hardware was flown.
The largest open item is the communications analysis in section 03. The interference figure is computed, but without the transmitter power and required signal-to-noise ratio from the manufacturer there is no way to confirm the links close at range over the lake. This would need resolving before committing to the aircraft.
The detection pipeline is specified from published literature rather than built and trained. It describes how blooms would be classified and how genera would be separated, but no model was trained on Skaneateles imagery and no detection performance is claimed.
The M1 ground risk mitigation is the weakest part of the SORA argument. It is assessed at low robustness because it depends on the operation being over water and on people being unlikely to be present, which is reasonable for a lake in a rural county but would not hold in a busier location.
The authorisation documents are written to the FAA process, since the client is a US city. Applying the same operation in Canada would require redoing the airspace authorisation against Transport Canada rules, and privacy legislation near residential shoreline would need separate assessment. Cold weather operation would also change the endurance figures the schedule depends on.